Featured Post

How to use Tabs in ASP.NET CORE

I want to show Components in a tabs , so first of all create few components. In this project we have three components, First View Component  public class AllViewComponent : ViewComponent     {         private readonly UserManager<ApplicationUser> _userManager;         public AllViewComponent(UserManager<ApplicationUser> userManager)         {             _userManager = userManager;         }         public async Task<IViewComponentResult> InvokeAsync()         {             List<StudentViewModel> allUsers = new List<StudentViewModel>();             var items = await _userManager.Users.ToListAsync();             foreach (var item in items)             {                 allUsers.Add(new StudentViewModel {Id=item.Id, EnrollmentNo = item.EnrollmentNo, FatherName = item.FatherName, Name = item.Name, Age = item.Age, Birthdate = item.Birthdate, Address = item.Address, Gender = item.Gender, Email = item.Email });             }            

Graph Introduction

Graph is a non-linear data structure which is a collection of nodes also called as vertices and edges also called as arcs. So, if 'G' is a Graph mathematically it is represented as, G=(V,E) where 'V' is the non empty set of vertices 'E' is the set of edges. The edge if it exists in the graph connects any two nodes only. There may be more than one edge connecting the same nodes. If the edges in a graph show direction then such edges are called as directed edges and the graphs containing such directed edges are called as directed graphs or simply digraphs. If the graph contains undirected edges (represented by straight lines) then it is called as undirected graph or simply graph.

 undirected graph

Set of vertices, V={A,B,C,D,E,F,G}
Set of edges, E={AB,AD,AF,BC, CE, DE, EG, FG}

In undirected graph the edge AB is similar to BA. Only one representation is considered. But in a directed graph the edge AB means, the edge starts from A and ends in B.
Directed Graph or digraph:
Directed Graph or digraph

Set of vertices, V={A,B,C,D,E,F,G}
Set of edges, E={AB,AD,CB,DE,EC,EG,FG,FA}
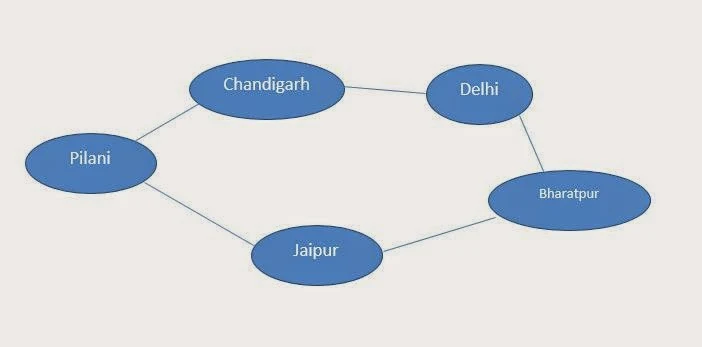
Scenario: A person moves from pilani to Jaipur by road. From Jaipur he reaches Delhi via Bharatpur. The person comes back to pilani via chandigrah.
How many places the person has visited? How much distance he has covered? How much time he takes to make a tip?
To answer all these questions it is necessary to go through the scenario many a times. If the same scenario is represented pictorially then answering the questions will be very easy. That is what the major benefit of graph is. See the following representation.

The above representation is a graph from which we can instantly say the person visited 4 places from pilani. If we mark the edges by means of either distance or time required to reach then the graph becomes weighted graph. See the following graph where the edges are marked with distances in kilometers.
weighted digraph

 From the above weighted graph we can easily say that the person has traveled 710 kilometers. If the edges are labeled with time as weight we can easily calculate the time required to cover the places. In the above graph there exists route from Pilani to Jaipur then vice-versa is also true. So, in undirected graph an edge is a two-way edge. But in case of digraph the edge if exists represents one-way.
Consider the following undirected graph:

Set of vertices, V={1,2,3,4,5,6}
Set of edges, E={12,14,16,23,35,45,56}, Number of edges=7
Degree of any vertex is total number of incident edges. So, in the graph degree of vertex 1 is 3, 2 is 2, 3 is 2, 4 is 2, 5 is 3 and vertex 6 is 2. Sum of degree of all vertices of graph is 14. The sum is always even. Number of edges in the graph is equal to 7. Therefore we can derive a relation between number of edges in a graph and sum of degree of vertices of graph. The relation is:
Number of edges in graph = 1/2 (Sum of degree of vertices)

      
Number of edges in graph


where m is number of edges of a graph, d(V)The same relation holds true for digraph also. In a digraph degree of a vertex is equal to sum of in degree and out degree.
In degree of a vertex is equal total number of edges entering into the vertex and out degree is equal to total number of edges going out of the vertex.
In the above graph there exists an edge from vertex 1 to 2. There is no direct edge existing from 1 to 3. But it is possible to move to 3 from 1 via 2. It is called as path. In a directed graph if the path terminates in a start node then it is cycle. There are 3 paths from node 1 to node 5. They are 1-2-3-5, 1-4-5 and 1-6-5. The path 1-2-3-5 is a collection of paths 1-2, 2-3 and 3-5. In a graph if two nodes are directly connected then there exists a direct path. If there exists an edge from one vertex 'i' to other vertex 'j' then node 'i' and 'j' are called as adjacent nodes. From the above graph we can list the adjacent nodes of each vertex as:
Graph Introduction

Comments

Popular Post

How to use Tabs in ASP.NET CORE

I want to show Components in a tabs , so first of all create few components. In this project we have three components, First View Component  public class AllViewComponent : ViewComponent     {         private readonly UserManager<ApplicationUser> _userManager;         public AllViewComponent(UserManager<ApplicationUser> userManager)         {             _userManager = userManager;         }         public async Task<IViewComponentResult> InvokeAsync()         {             List<StudentViewModel> allUsers = new List<StudentViewModel>();             var items = await _userManager.Users.ToListAsync();             foreach (var item in items)             {                 allUsers.Add(new StudentViewModel {Id=item.Id, EnrollmentNo = item.EnrollmentNo, FatherName = item.FatherName, Name = item.Name, Age = item.Age, Birthdate = item.Birthdate, Address = item.Address, Gender = item.Gender, Email = item.Email });             }            

Polynomial representation using Linked List for Data Structure in 'C'

Polynomial representation using Linked List The linked list can be used to represent a polynomial of any degree. Simply the information field is changed according to the number of variables used in the polynomial. If a single variable is used in the polynomial the information field of the node contains two parts: one for coefficient of variable and the other for degree of variable. Let us consider an example to represent a polynomial using linked list as follows: Polynomial:      3x 3 -4x 2 +2x-9 Linked List: In the above linked list, the external pointer ‘ROOT’ point to the first node of the linked list. The first node of the linked list contains the information about the variable with the highest degree. The first node points to the next node with next lowest degree of the variable. Representation of a polynomial using the linked list is beneficial when the operations on the polynomial like addition and subtractions are performed. The resulting polynomial can also

Print the asp.net webpage using button

Introduction Today i am talking about printing, and how to print the content or you can say selected content in asp.net. If you have a webpage and you want to print this then you have to choose command key (ctrl+p) for that. Also you want to print the selected part then you have to select the text first then you have to use command key. But sometimes your selected page could not printed. So many websites provide the printing facilities on the webpage. Today i am talking about the same topics here. Lets take a simple example to demonstrate the topic. Source code: <%@ Page Language="C#" AutoEventWireup="true" CodeFile="printpage.aspx.cs" Inherits="printpage" %> <!DOCTYPE html> <html xmlns="http://www.w3.org/1999/xhtml"> <head>     <title></title> <script> function printpage() { var getpanel = document.getElementById("<%= Panel1.ClientID%>"); var MainWin